Eight Charts That Explain the Immigration Debate
What the numbers reveal about policy, politics, and people
We’re only two days away from our next edition of The Preamble, where our topic is AI: the good, the bad, and the future. Inside, you’ll get access to an interview with top clinical psychologist Dr. Lisa Damour on what parents need to know about AI, a doctor who cured his own disease and uses AI to help others, and a thought-provoking article on our desire to live in a frictionless world.
And now, we want to hear from you! We’ve loved reading your Letters to the Editor, and there’s still time for you to submit yours. It can be on AI, or anything else on your mind.
Submit your letter to the editor here!
Debates about immigration and the activities of Immigration and Customs Enforcement (ICE) loom large in today’s headlines. There’s no shortage of important discussions to be had about the ethics, tradeoffs, and necessity (or lack thereof) of government policies and actions to address unlawful immigration into the United States.
To have those thoughtful conversations, it can be helpful to get our heads around some of the actual trends on the ground. This article provides eight charts to offer, hopefully, some clarity.
As we’ll see, while the charts themselves are simple (shout-out to the humble bar chart!), the data collection efforts behind many of them are not, which itself may shed light on some of the disagreements related to ICE and immigration.
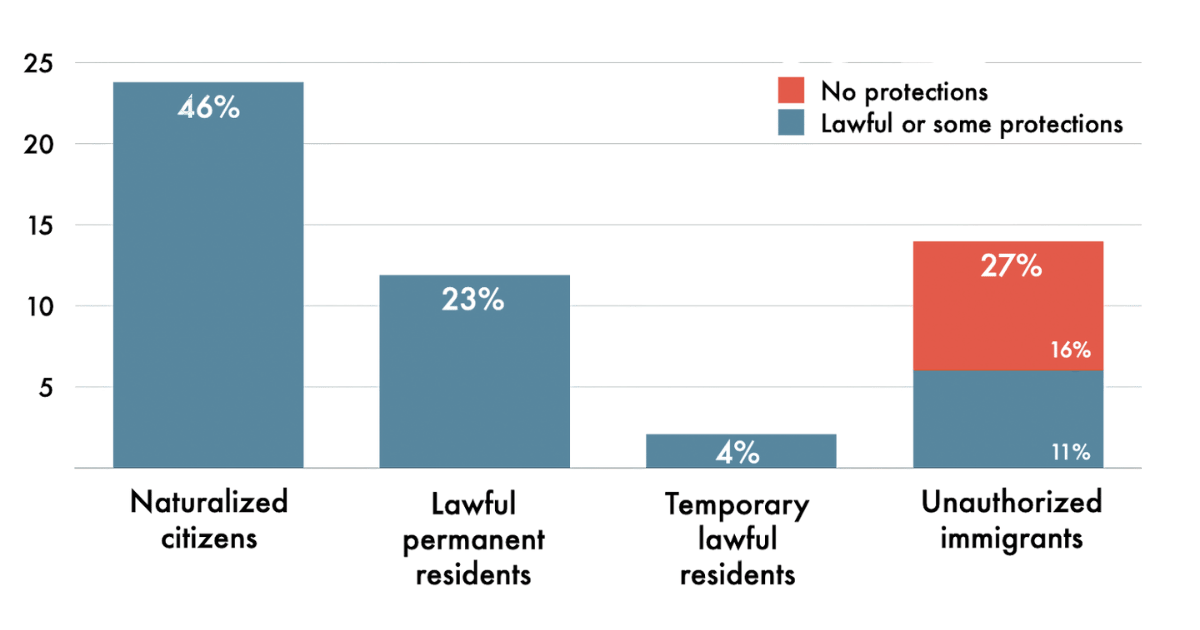
1. Most foreign-born residents in the US are naturalized citizens.
Immigration status of foreign-born residents in the US, in millions (as of mid-2023)
Source: Pew Research Center
Seventy-three percent of foreign-born people in the US are in the country legally. Whether they’re naturalized citizens, lawful permanent residents (green card holders), or temporary lawful residents (e.g., here on student or temporary work visas), the vast majority of immigrants in the US are well-documented, legal members of the US population.
Things get trickier, in both politics and research, when it comes to the not-so-lawfully-here group of immigrants. Twenty-seven percent of foreign-born people in the US are classified as “unauthorized immigrants” — a catch-all term for immigration statuses that are not one of the first three categories.
“Unauthorized” does not imply “illegal.” An estimated 40% of these unauthorized immigrants (blue in the fourth column above; approximately 11% of all immigrants) entered the country legally through special policies, many of which protect them from deportation. For example, there are special permissions for people from Ukraine or Afghanistan, protections granted because of conflict or natural disasters, humanitarian parole protections, and many more.
The primary debate around “illegal” immigrants thus ought to turn on the other 60% of these “unauthorized” immigrants (in red in the fourth column above; approximately 16% of all immigrants) who do not have such protections. That said, some argue that many among the “protected” group, while they may have entered the US legally, have since illegally overstayed and should now be counted as illegal. The very designation of “lawful” or “unlawful” unauthorized immigrants is politically debated.
An additional complication is that the less “authorized” someone is to be here, the harder it typically is to include them in datasets. In fact, the people we perhaps are most interested in from a policy perspective — people here with zero documentation whatsoever — are the very people with the strongest incentives to stay undetected.
This means the numbers presented above are necessarily estimates for this population based on a combination of sources and analytic methods. While there’s a fair amount of evidence that these estimates are robust — primarily including the fact that they are largely comparable across different data collection strategies — it is worth remembering we are working with incomplete information and that the most recent reliable numbers are from mid-2023.
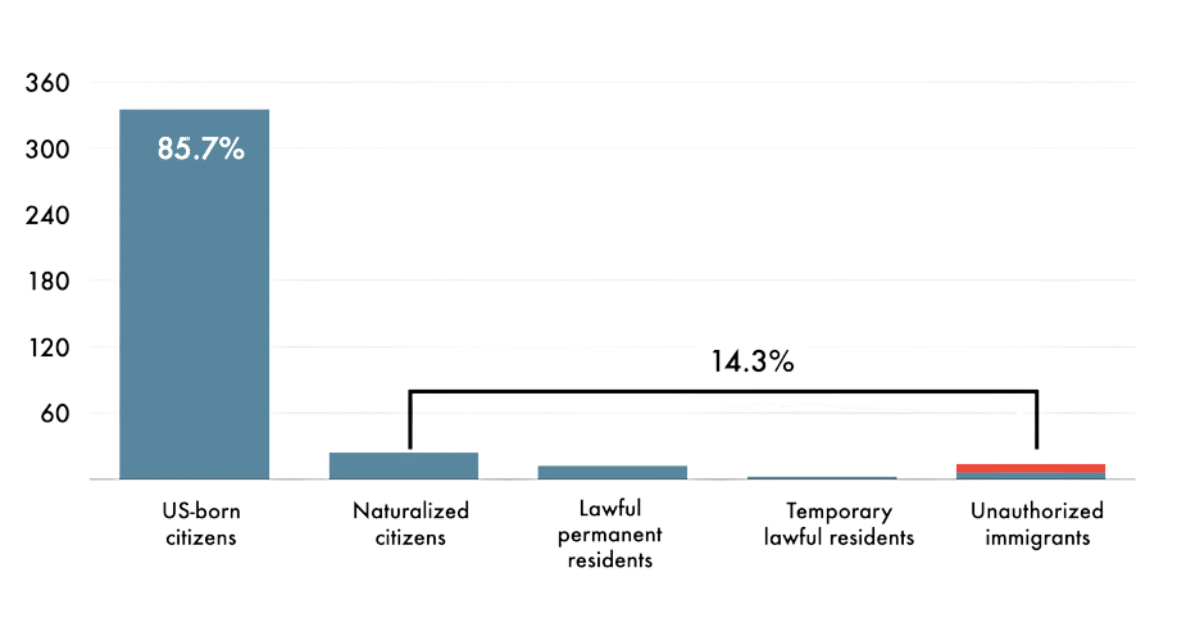
Foreign-born residents make up approximately 14% of the US population.
Citizenship and immigration status of residents, in millions (as of mid-2023)
Sources: Pew Research Center & American Immigration Council
Overall, the proportion of people in the US who are foreign-born was 14.3% as of 2023. In January of 2025, it was estimated to be 15.8%, the highest proportion of foreign-born residents since 1850. By June the estimate had fallen to 15.4%.
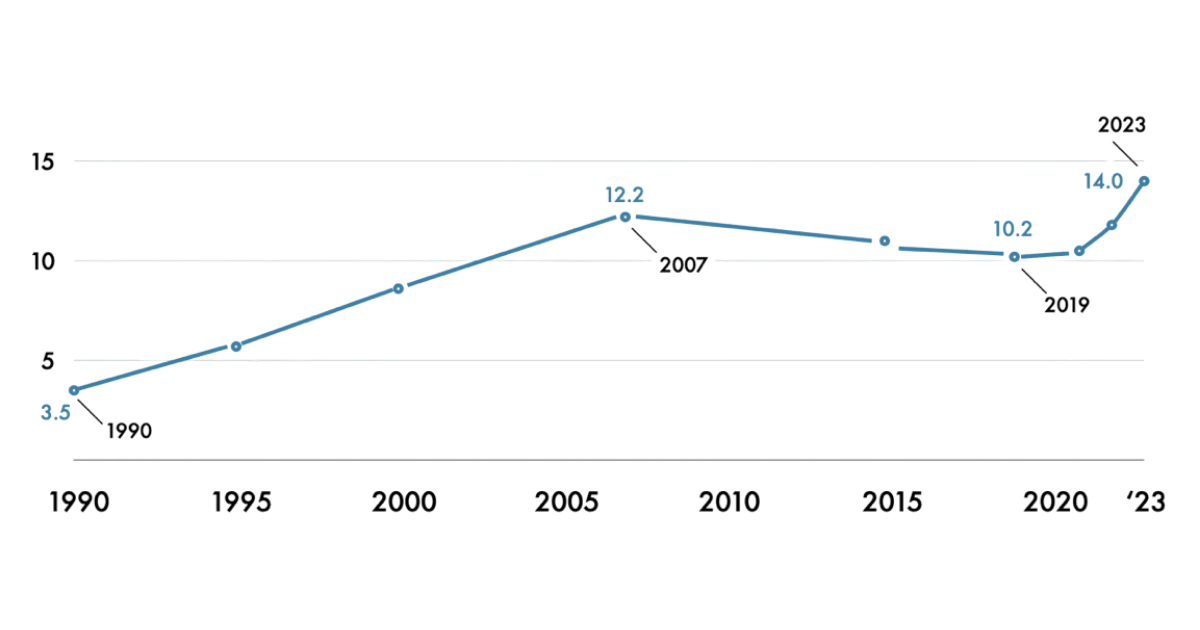
3. The number of unauthorized immigrants in the US reached a record high in 2023
Estimated unauthorized immigrants, in millions, since 1990
Source: Pew Research Center
The total number of unauthorized immigrants in the US reached an all-time high in 2023, with 14 million people estimated to be present without full legal status. The previous peak was in 2007 with 12.2 million. (Estimates from more tentative data since suggest this number continued to increase in 2024 and has since gone down a bit in 2025.)
At the center of the current debate is a large uptick in unauthorized immigration under the Biden administration. According to Pew, this growth was largely due to increases in arrivals of people with the more precarious or temporary protections described above rather than not-at-all-legal entries.
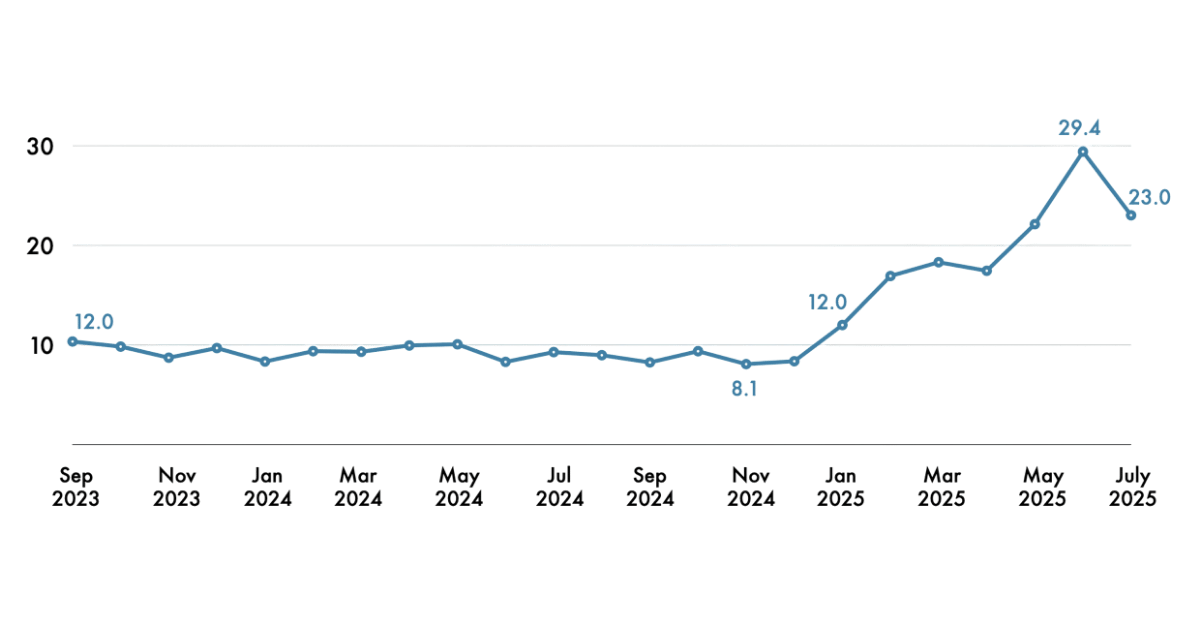
4. Average monthly ICE apprehensions have more than doubled since Trump took office in January 2025
ICE arrests by month, in thousands, as of July 2025
Source: Deportation Data Project
In 2024, ICE made an average of just under 9,000 apprehensions per month. From February through July of 2025, this increased to more than 21,000 per month, consistent with a push by the Trump administration to increase arrests.
This data on ICE activities comes from the Data Deportation Project, which obtained it through a Freedom of Information Act (FOIA) request followed by a lawsuit. It is not clear when the next update will be provided, so July 2025 is the latest month for which data is available.
5. ICE has apprehended a smaller proportion of immigrants who are convicted criminals in 2025 than in 2024
Percentage of all apprehensions by criminality status
Source: Deportation Data Project
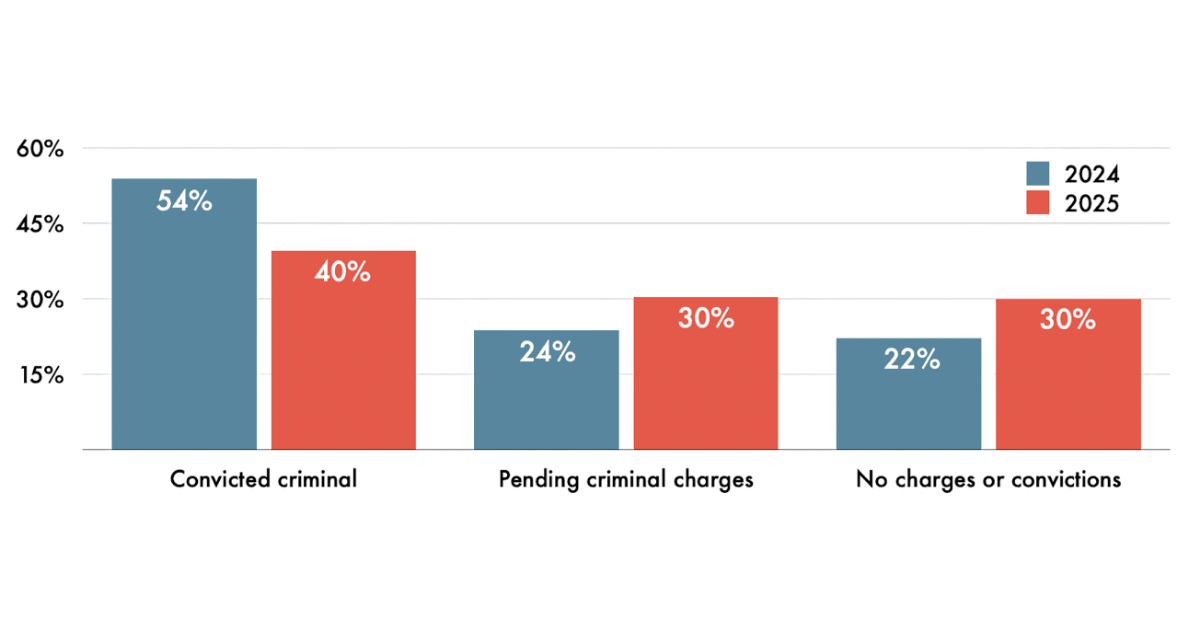
When someone is apprehended by ICE, they are categorized according to one of three categories: “convicted criminal,” “pending criminal charges,” or “other immigration violator” (meaning no charges or convictions).
In 2024, 54% of apprehensions were of convicted criminals, whereas in 2025 only 40% have been. If the goal of ICE is to apprehend convicted criminals, then their accuracy has decreased by 14 percentage points. If their goal is to increase the number of apprehended convicted criminals, then they are succeeding. From January 21 to July 29 of this year (the first full day of the Trump administration through the most recent data available), ICE apprehended more than 52,000 convicted criminals, compared with 31,000 during the same period in 2024.
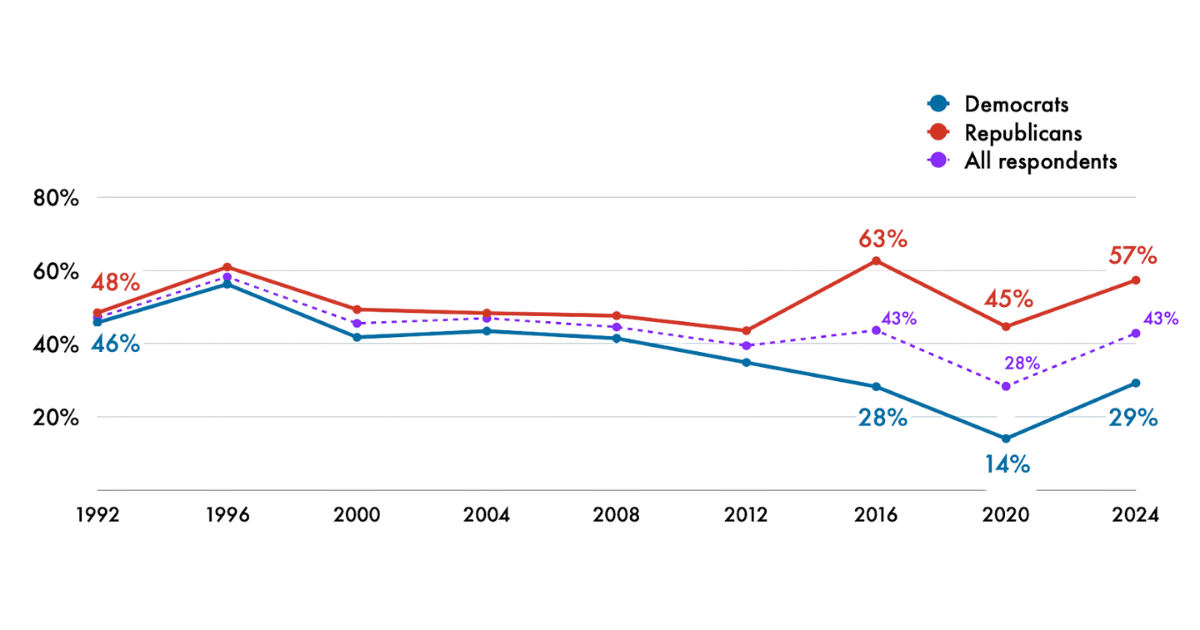
6. More than half of Republicans and nearly a third of Democrats believe the number of immigrants to the US should be decreased
Percentage of survey respondents who said they believed immigration should be decreased by “a little” or “a lot,” by political party
Source: American National Election Studies (ANES)
The American National Election Studies (ANES) dataset offers among the most comprehensive and longest-running data on American public opinion. Since 1992, this nationwide survey has asked respondents whether they believe immigration (of all kinds, not just unauthorized) should be increased, be decreased, or stay the same.
Until 2012, self-identified Republicans (and Republican-leaning independents) and Democrats (and Democratic-leaning independents) shared similar views on immigration. They diverged in 2012, with the largest gap, of 35 percentage points, in 2016. It has remained wide since, although the Democratic and Republican percentages have also risen and fallen together since then.
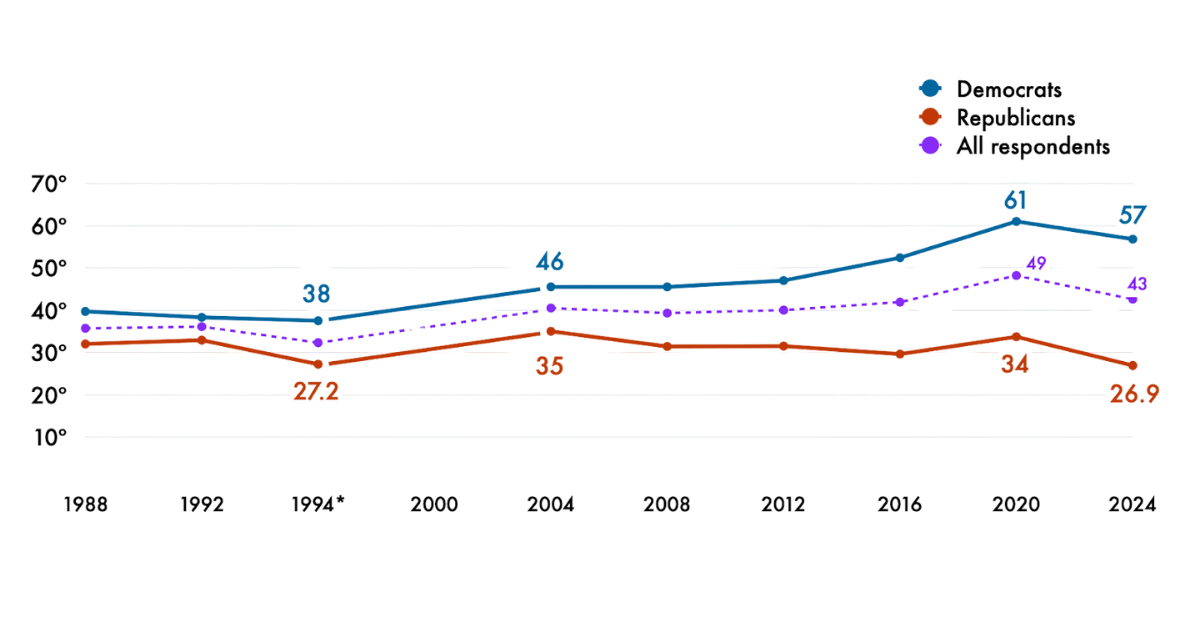
7. The gap between Republicans’ and Democrats’ attitudes toward illegal immigrants has widened.
Mean score, by political party, among survey respondents asked to rate illegal immigrants according to a “feeling thermometer” from 0 (coldest) to 100 (warmest)
Source: American National Election Studies (ANES).
We also see a partisan divergence when we consider attitudes toward “Illegal immigrants.” The chart above shows responses, again by self-identified party (and party-leaning independents), to a question that asks participants to rate “illegal immigrants” on a “feeling thermometer,” where 0 is “coldest” (very unfavorable) and 100 is “warmest” (very favorable). (The language of the question did not distinguish between illegal and unauthorized immigrants as defined above.)
In 1992 there was a gap of just five “degrees.” The most recent data, from 2024, shows a gap of about 30 degrees, the largest to date. Republican sentiment also (just barely) hit an all-time low at 26.9; the prior record was in 1996.
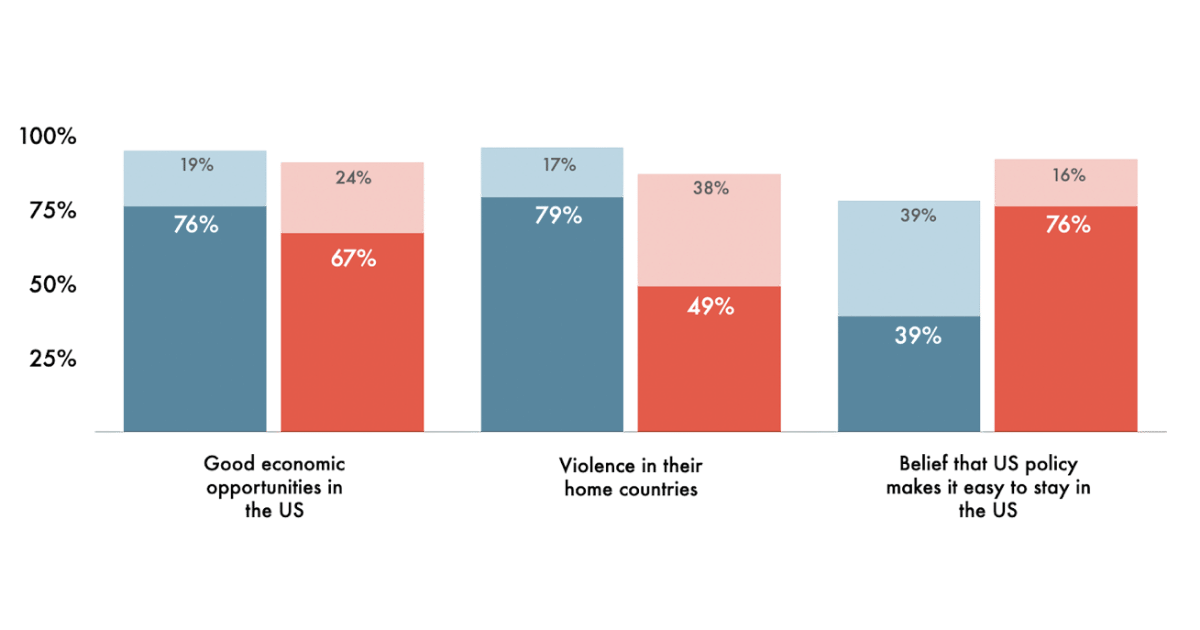
8. Republicans and Democrats have diverging views on the causes of increased migration to the US over the US–Mexico border
Percentage of survey respondents who considered each of the below a major (dark) or minor (light) reason for increases in migration to the US over the US–Mexico border (2024)
Source: Pew Research Center
Why do we see these diverging attitudes towards immigration by party? Two common explanations for anti-immigrant sentiments center around economic hardship and cultural fears. A long-standing finding in political science research on immigration attitudes around the world suggests that fears about cultural change tend to be the biggest drivers of attitudes toward immigration, even more than concerns about economic impacts. More recent research finds that while job loss among white Americans is associated with increased support for deporting unauthorized immigrants, it’s unlikely that these attitudes are directly tied to labor force competition. Instead, these attitudes are much more likely a reflection of channeling one’s own frustrations toward an out-group.
Another striking pattern emerges when Americans are asked why they think immigration is increasing. We again see a notable gap between Democrats and Republicans. Specifically, 76% of Republicans said that lax US policies that make it easy to stay in the country after arriving are a major driver of immigration across the US–Mexico border. Only 39% of Democrats cite this as a major reason, with more Democrats pointing to economic opportunities in the US and/or violence in immigrants’ home countries.
This is only one survey, and it’s from more than a year ago, but it does offer yet another lens on our diverging views: entirely different explanations for why immigration is increasing in the first place. This is also consistent with a recent finding that 76% of Republicans express a favorable view of ICE (compared with only 13% of Democrats), as ICE may specifically be helping to resolve the problem of lax policies identified by Republicans.
***
In summary, we learn a few important things from these charts. First, unauthorized immigrants are a small proportion of all immigrants, and a very small proportion of the overall US population. Second, just what counts as “unauthorized,” and the extent to which that is “illegal,” is not obvious and is frequently disputed. Third, collecting data both on immigration and ICE is not for the faint of heart, but is crucial to our ability to understand what’s going on. Fourth, ICE has become more active and, depending on how you evaluate it, less accurate in arresting convicted criminals who are foreign-born. Finally, Americans’ views on immigration diverge considerably, whether we consider legal immigration, illegal immigration, or the reasons for immigration in the first place.



This is a great way to "see" the data in a new light. Very helpful.
This article clears up a lot of misconceptions that people have about immigration. I can’t wait to share it within my circle of friends that think all immigrants are illegal.